Value Stream Mapping
Overview
Value stream mapping (VSM) is a lean tool that uses a flowchart to document every step in a process. Often, VSM is seen as a fundamental tool to identify waste, reduce process cycle times, and implement process improvement.
VSM is designed to combine material processing steps with information flow as well as other important related data. It is an essential lean tool for organizations that want to plan, implement, and improve while on a lean journey. VSM helps users create a solid implementation plan that will maximize their available resources, and help ensure materials and time are used efficiently.
The “value stream” portion of VSM focuses on how value is added to a product or service by changing its market form or function to meet customer needs. From a lean perspective, the end customer defines the value. An activity is considered value-added only if the customer is willing to pay for it and it contributes directly to meeting customer requirements. This includes adding features and functionality that benefit the customer while avoiding unnecessary time, effort, or materials—referred to as muda, the Japanese term for waste—on the organization’s side.

How to perform VSM
When performing VSM, it is important to first understand the scope of the value stream under examination. The VSM represents a single area in the organization. When multiple plants, customers, or suppliers are included, however, an extended-level map is created.
An extended-level map is the 60,000-foot view of the value stream, the facility level map is the 30,000-foot view, and the process level map is the 10,000-foot view. To avoid optimizing one area but suboptimizing another, start diagramming a facility-level map before attempting to draw a process-level or extended-level map.
These are the steps to follow to create a facility level map:
Step 1: Build a Team
Form a cross-functional team of high-level managers and supervisors from throughout the organization to create a lean value stream map. The ideal team size is about 10 members. Sometimes, small teams can miss important items, while large teams can be difficult to manage and coordinate.
Step 2: Hold a Kaizen Kick-Off
After the VSM team is formed, hold a kaizen event, which often lasts two to five days, to begin developing current and future plans. At the kaizen event, the team must complete four important steps:
- Determine the process family.
- Draw the current state map.
- Determine and draw the future state map.
- Draft a plan to arrive at the future state.
Step 3: Determine the Process Family
A process family, also known as a product family, is a group of products or services that go through the same or similar processing steps.
To determine the process family, create a matrix. Along the top row, write the process steps the organization performs from a 30,000-foot point of view.
- In the first column, write the parts (for example, components, stock keeping units, finished good items, or services) the organization makes or provides.
- Place an X in the corresponding box if the part goes through the processing step.
Step 4: Identify Similarities
Examine the matrix and look for sections that have similar or identical processing steps. Also look for sections that share about 80% of the steps. Consider items that share many of the same steps and procedures that can be created together—by the same workers using similar or related steps—more efficiently.
Next, identify which process family to concentrate on first. Consider areas such as:
- Biggest "bang for the buck."
- Largest reduction in lead time or inventory.
- Biggest customer impact.
- Highest probability for success.
- Most visibility to stakeholders.
- New product or service line.
- Volume or quantity.
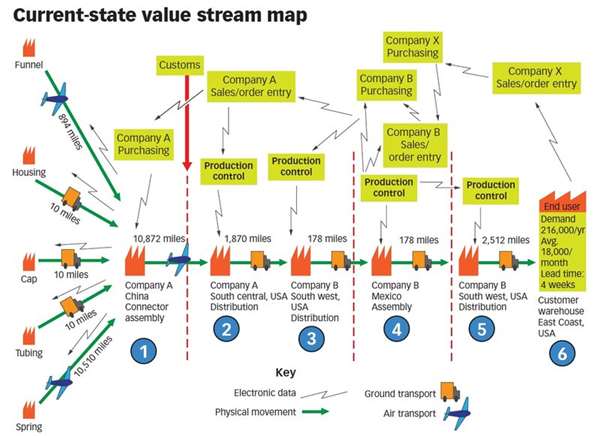
Step 5: Create a Current State Map
To create a current state map, collect data and information by going to the gemba, which is where the work happens. Walk the flow and interview those who perform the task. Gather high-value information, including:
- Cycle time or processing time.
- Changeover time.
- Equipment reliability.
- First pass yield.
- Quantities.
- Number of operators and shifts.
- Hard copy information.
- Electronic information.
- Inventory levels.
- Queue or waiting times.
Step 6: Create a Basic VSM Template
After the team gathers and reviews the information obtained while at the gemba, draw the value stream map.
Include these key areas on the map:
- Customer information.
- Supplier information.
- Information flow.
- Material (or product) flow.
- Value-added and nonvalue-added time.
Step 7: Create a Future State Map
Create the future state map by answering questions such as:
- What is takt time?
- Are there bottlenecks or constraints?
- Where can inventory (or queue time) be reduced or supermarkets used?
- Where can you improve flow?
- What other improvements are required?
On the VSM, place a kaizen burst (a sticky note or thought bubble) around any items that need improvement.
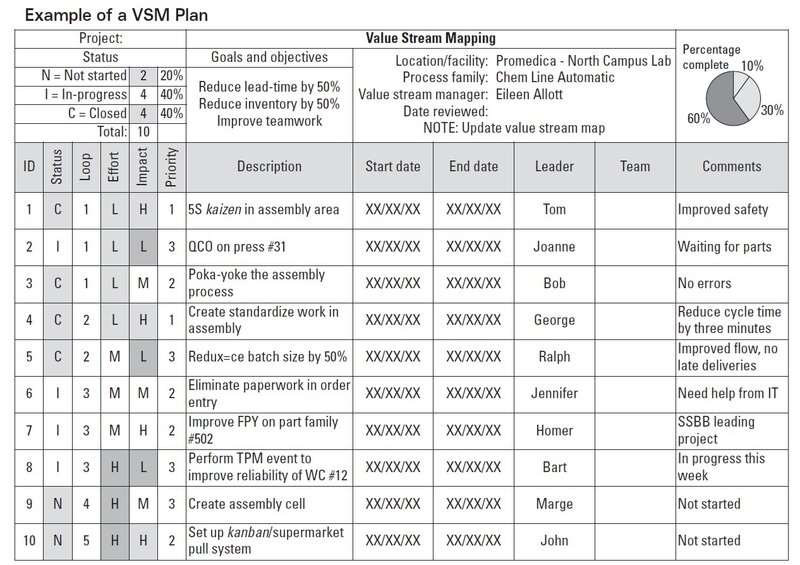
Step 8: Create a VSM Draft Plan
Arguably, this is the most important part of VSM. During a typical VSM event, it is possible to create the draft plan based on the information from the future state map. The plan will need further refinement, especially in determining resources required, such as time, people, and budgets. A good plan includes the project description, the project leader’s name, possible team members, a schedule (or Gantt chart) of events and deliverables, a cost estimate, and the impact, goals, or benefits.
For a more detailed breakdown of how to perform VSM, see Tony Manos, “Lean Lessons: Value Stream Mapping—an Introduction,” Quality Progress, June 2006, pp. 64-69.
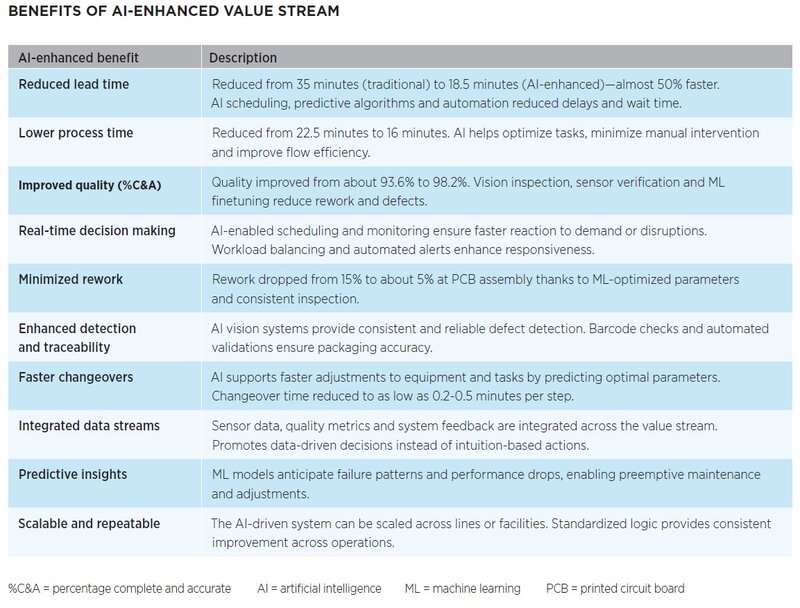
VSM and AI
When integrated with artificial intelligence (AI), VSM transforms from a static mapping exercise into a dynamic, data-driven decision making tool. Here’s how AI enhances each stage:
- Automated data collection. AI systems can gather process data in real time, eliminating the need for manual stopwatch timing and interview-based estimates.
- Dynamic and real-time VSM. AI enables digital twins of processes—virtual representations that update automatically as conditions change. This provides a live VSM, not a static snapshot.
- Pattern recognition and bottleneck detection. Machine learning (ML) models analyze large volumes of process data to identify delay patterns, rework, and idle time that are not obvious to humans or can be missed by manual analysis.
- Predictive analytics. AI can forecast the effect of proposed process changes before implementation.
- Enhanced root cause analysis. AI-powered analytics can drill down into causality by correlating variables across time and systems, which supports more accurate problem solving during the analyze phase of the define, measure, analyze, improve, and control process.
- Continuous improvement and optimized process settings. After the initial VSM model is ready, AI algorithms can find the optimal machine settings that minimize defects and reduce cycle time.
By integrating AI and ML into lean Six Sigma initiatives, organizations can move beyond retrospective analysis and enable real-time optimization, predictive foresight, and continuous learning. This elevates process improvement from reactive to strategic and sets the foundation for true operational excellence.
Case Studies
Check out the following case studies for more real-world applications of VSM:
- Aerospace. Boeing’s C-17 stuffed tailcone team took home an ASQ International Team Excellence Award prize for eradicating unsafe working conditions. The team used quality tools such as VSM to choose the project and determine potential solutions. The final solution eliminated safety hazards and reduced budget hours by more than 300%. (Nicole Adrian “A Gold Medal Solution,” Quality Progress, March 2008, pp. 44-50.)
- Healthcare. A regional Midwest acute care hospital wanted to reduce waste and improve patient care, but it went about it the wrong way. Instead of taking a lean approach to value stream analysis, the quality improvement team selected a Six Sigma approach. The author compares the two approaches and explains why the team should have chosen a lean approach instead. (Christopher D. Chapman, “The Right Tool for the Job,” Quality Progress, December 2021, pp. 74-79.)
- Telecommunications. When a global telecommunications organization began outsourcing manufacturing operations, it added waste to its supply chain, resulting in suboptimized performance. The organization deployed tools such as VSM, the eight rights and a plan for every part to evaluate the system to identify and remove inefficiencies. (Bill D. Bailey and Howard Alter, “No Weak Links,” Quality Progress, June 2014, pp. 14-21.)
Related Video
Tiered Visual Management, Line of Sight Metrics and Value Stream Mapping
Bryan Krieg, Six Sigma Black Belt, Genesis HealthCare System, explains the tiered visual management process through all four tiers using line of sight metrics. He also offers an example of the use of a very important tool for the process, value stream mapping.
Community
myASQ’s online communities provide expanded networking and learning opportunities, including blog posts, discussion threads, and library entries on topics like the fishbone diagram. Members can create new communities to generate new discussions and connections, and anyone can join online communities to reach a broader audience of quality professionals and practitioners – anytime, anywhere.

Certifications
ASQ offers 19 different certifications ranging from foundational quality to advanced quality management, including five ANSI ANAB ISO 17024 accredited programs. Earning an ASQ Certification provides you an opportunity to learn quality tools & concepts and gain a credential that can increase your earning potential and help grow your career.
Learn more about ASQ Certification
View Certification Preparation Resources (Virtual Courses, E-Learning, Question Banks, & Handbooks)
Reviewers
Matthew C. Mateos is an ASQ Master Black Belt. He received an MBA and a bachelor of science in chemical engineering from the University of Toledo in Ohio. A senior member of ASQ, Mateos has 12 ASQ certifications and specialized credentials in lean and risk management. He also has specializations in advanced statistics, biostatistics, neural networks, differential and integral calculus from Johns Hopkins University in Baltimore; agentic artificial intelligence (AI), generative AI and prompt engineering from Vanderbilt University in Nashville, TN; data analysis, data science, AI product management, machine learning operations and large language model operations from Duke University in Durham, NC; business analytics, financial technology, and business, financial and quantitative modeling from The Wharton School in Philadelphia; design of experiments from Arizona State University in Tempe; statistical thermodynamics, systems engineering, and project management from the University of Colorado in Boulder; and strategic leadership from Dartmouth College in Hanover, NH.
Reviewed January, 2026.
References
Nicole Adrian, “A Gold Medal Solution,” Quality Progress, March 2008, pp. 44-50.
Bill D. Bailey and Howard Alter, “No Weak Links,” Quality Progress, June 2014, pp. 14-21.
Christopher D. Chapman, “The Right Tool for the Job,” Quality Progress, December 2021, pp. 74-79.
Tony Manos, “Lean Lessons: Value Stream Mapping—an Introduction,” Quality Progress, June 2006, pp. 64-69.
Jayet Moon, “Mapping Value,” Lean & Six Sigma Review, Vol. 24, No. 4, 2025, pp. 8-15.
Reprints & Permissions
ASQ gladly considers requests to use its intellectual property, please see the ASQ reprint permission page for more information. For use of ASQE content or graphics, please contact us at orgmembership@asq.org to request permission.
Join Us on Social
Network with the world’s largest community of quality professionals.


