Flowchart
Overview
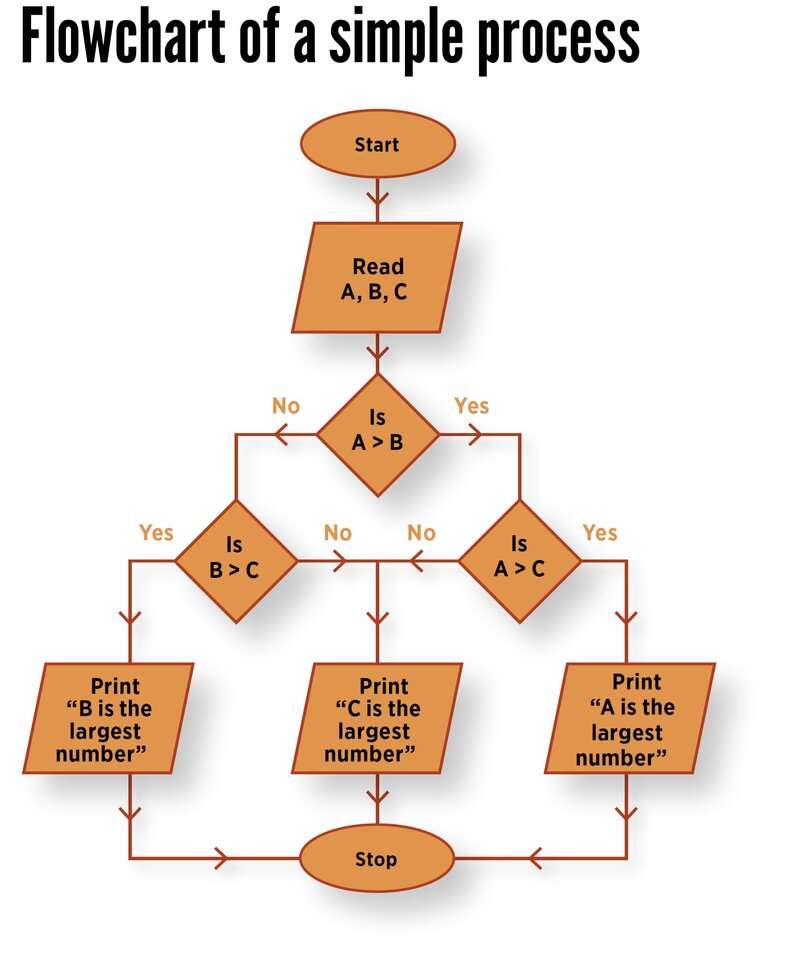
A flowchart is a common type of process map that visually represents the steps of a process, system, or workflow in sequential order. Using symbols and arrows, a flowchart makes complex processes easier to understand, analyze, and improve. This generic tool can be adapted for a wide variety of purposes and used to describe various processes, such as a manufacturing process, an administrative or service process, or a project plan. The flowchart also is one of the seven basic quality tools.
Elements that may be included in a flowchart include a sequence of actions, materials or services entering or leaving the process (inputs and outputs), decisions that must be made, people who become involved, time involved at each step, and process measurements.
Flowcharts not only highlight the immediate steps before and after a process step, but also help explain the relationship between those steps through a rational flow. Flowcharts create a bigger picture of the entire process, which makes them an excellent tool to use in problem solving and process improvement. Flowcharts also help identify the critical process steps that contribute to key performance indicators. When drawn out, a flowchart can help identify and eliminate nonvalue-added steps. Flowcharts can be used to improve processes, identify waste, and understand the root causes of problems.

When to use a flowchart
- To understand how a process is performed.
- To communicate how a process is performed.
- To study a process for improvement.
- To facilitate better communication among people involved with the same process.
- To document a process.
- To plan a project.
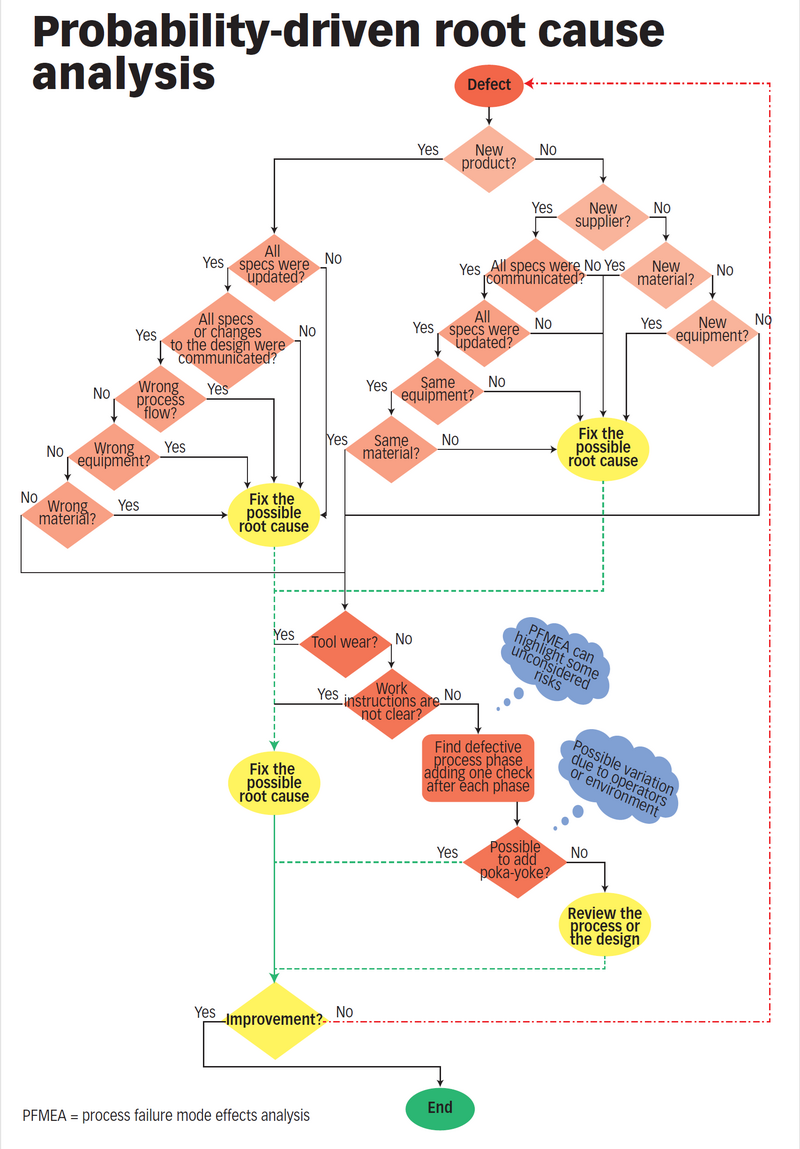
- To accelerate root cause analysis.
- To define process boundaries.
- To verify and identify customer-supplier relationships in a process.
- To determine the best method of performing a process.
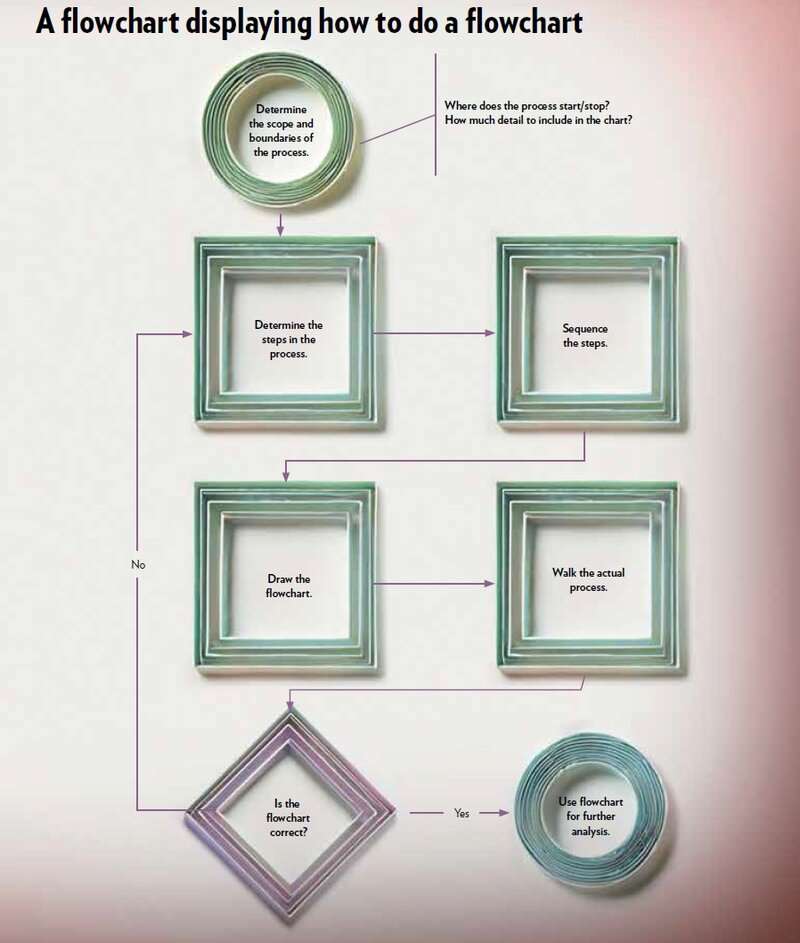
Flowchart Basic Procedure
Use whatever charting tools work best for your team, such as sticky notes on a wall, MS Word, MS PowerPoint, MS Visio, or a whiteboard.
- Define the process to be diagrammed. Write its title at the top of the work surface.
- Determine the process’s scope and boundaries. Where or when does the process start? Where or when does it end? Determine how much detail to include in the diagram.
- Determine the process’s steps and activities, and write each on a card or sticky note.
- Arrange the activities in proper sequence.
- When all activities are included and everyone agrees the sequence is correct, draw arrows to show the process’s flow.
- Review the flowchart with others involved in the process (workers, supervisors, suppliers, and customers) to see whether they agree the process is drawn accurately. A good way to do this is to walk through the process.
- Determine whether the flowchart is correct. If so, you’re done! If not, return to step three and work through the steps again.
After the flowchart is complete, review it to address any issues such as:
- Unclear steps.
- Bottlenecks.
- Sources of delay.
- Sources of error or rework.
- People, knowledge, or authority gaps.
- Duplication.
- Excessive handoffs.
- Cycle time.
- Unnecessary steps.
Use the flowchart template (Excel) to create a graphical representation of the steps in a process to better understand it and reveal opportunities for improvement.
Flowchart Considerations
- Don't worry about drawing the flowchart the "right way." Ultimately, the right way is the way that helps those involved understand the process.
- Use a cross-functional team. Identify and include all key people involved with the process, such as suppliers, customers, and supervisors.
- Do not assign a technical expert to draw the flowchart. People who perform the process should draw it.
- Chart the current state. Use process documentation to help construct the flowchart.
- Walk through the process after completing the first draft to ensure it's accurate.
Commonly Used Symbols
 One step in the process. The step is written inside the box. Usually, only one arrow goes out of the box.
![]() Direction of flow from one step or decision to another.
Direction of flow from one step or decision to another.
 Decision based on a question. The question is written in the diamond.
More than one arrow goes out of the diamond, each one showing the direction the process takes for a given answer to the question. (Often the answers are "yes" and "no.")
Decision based on a question. The question is written in the diamond.
More than one arrow goes out of the diamond, each one showing the direction the process takes for a given answer to the question. (Often the answers are "yes" and "no.")
![]() Delay or wait
Delay or wait
 Link to another page or another flowchart. The same symbol on the other page indicates that the flow continues there.
![]() Document
Document
![]() Alternate symbols for start and end points
Alternate symbols for start and end points
Related Video
Process Mapping and Architecture
In this episode, learn process map and flowchart basics and how to use a process architecture map to improve the process and identify lean wastes.
Community
myASQ’s online communities provide expanded networking and learning opportunities, including blog posts, discussion threads, and library entries on topics like the fishbone diagram. Members can create new communities to generate new discussions and connections, and anyone can join online communities to reach a broader audience of quality professionals and practitioners – anytime, anywhere.

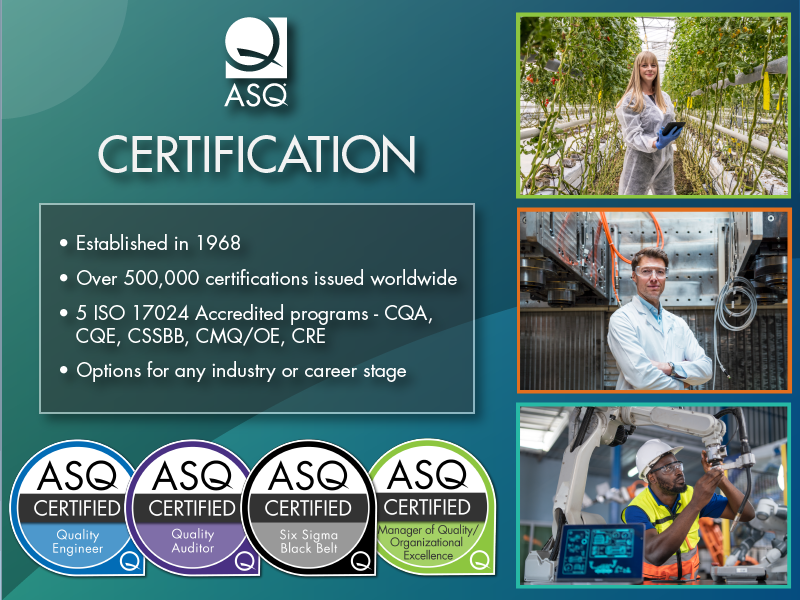
Certifications
ASQ offers 19 different certifications ranging from foundational quality to advanced quality management, including five ANSI ANAB ISO 17024 accredited programs. Earning an ASQ Certification provides you an opportunity to learn quality tools & concepts and gain a credential that can increase your earning potential and help grow your career.
Learn more about ASQ Certification
View Certification Preparation Resources (Virtual Courses, E-Learning, Question Banks, & Handbooks)
Reviewers
Stephanie Parker is the Director of Quality Management at Boon Edam in Lillington, NC. She holds a master's of science in statistics from Texas A&M University in College Station. Parker is a senior member of ASQ, a past chair of the Customer-Supplier Division, and an ASQ-certified quality engineer, quality auditor, Six Sigma Black Belt and supplier quality professional.
Reviewed June 2025.
References
Don Arp Jr., Gary G. Jing, Katie Labedz, Stephanie Parker, and W. Frazier Pruitt, "Tool Talk," Quality Progress, August 2024, pp. 12-25.
Moreno Broccoletti, “One Good Idea: Probable Cause,” Quality Progress, September 2013, p. 64.
Venkata Charan Kantumuchu, “Back to Basics: More Than Meets the Eye,” Quality Progress, July 2020, p. 56.
Nancy R. Tague, The Quality Toolbox, 3rd ed., Quality Press, 2024.
Reprints & Permissions
ASQ gladly considers requests to use its intellectual property, please see the ASQ reprint permission page for more information. For use of ASQE content or graphics, please contact us at orgmembership@asq.org to request permission.
Join Us on Social
Network with the world’s largest community of quality professionals.

